

When porometry curves are not ideal: how to still extract reliable results

Capillary flow porometry is a powerful technique for determining pore size and pore size distribution in filter media. In theory, the measurement results are straightforward: well-defined wet and dry curves lead to clear and reliable conclusions.
In practice, however, measurement curves are not always ideal.
Irregular shapes, noise, or unexpected deviations are common—and they can make data interpretation much more challenging than expected.
Why curve quality matters
In capillary flow porometry, the quality of the measurement curves directly impacts the accuracy of the results. Parameters such as largest pore size, mean flow pore size, and pore size distribution all depend on how well these curves represent reality.
While ideal curves are often shown in textbooks or application notes, real-world measurements frequently deviate from this perfect shape. These deviations can introduce uncertainty and complicate interpretation.
Why do non-ideal curves occur?
Non-ideal curves are not necessarily a sign of incorrect measurements. In many cases, they are simply a consequence of the sample itself.
For example, dense materials with low permeability can result in very low flow levels. The measurement noise may become more dominant in such conditions and the resulting curves may appear irregular or distorted.
These effects are part of real-world testing and must be correctly understood rather than ignored.
The challenge: interpreting imperfect data
When curves deviate from the expected shape, it becomes difficult to determine whether observed features are material-related—or simply artifacts of the measurement.
This is where many users struggle:
How reliable are the extracted pore size values?
Which part of the curve should be trusted?
Are deviations meaningful or misleading?
Without proper tools, these questions can lead to uncertainty in decision-making.
How curve fitting helps
To extract meaningful information from non-ideal data, advanced curve processing techniques are essential.
Modern analysis software, such as PoreSuite, uses curve fitting to:
Reduce noise in experimental data
Smooth irregularities
Fit curves to mathematical functions that best represent the data
This process helps reveal the underlying trend of the measurement while minimizing the impact of noise.
Importantly, different fitting approaches can lead to different interpretations—making it crucial to understand how these methods influence your results.

Discover our PoreSuite software
PoreSuite makes it very easy to present multiple measurements next to each other, allowing for a straightforward comparison between different filter media and samples.
Going one step further: distribution curve processing
Beyond basic curve smoothing, advanced analysis also focuses on the pore size distribution itself.
Different fitting models can be applied, including:
Single Gaussian distributions
Exponentially modified Gaussian models
Multiple Gaussian fits for complex or bimodal materials
These approaches allow users to better represent materials with non-uniform pore structures and improve the reliability of the final interpretation.
From raw data to confident conclusions
The key takeaway is simple:
Non-ideal curves are a normal part of porometry—but they require the right approach to interpret correctly.
By applying advanced curve processing techniques, it becomes possible to:
Reduce uncertainty
Improve data quality
Draw more reliable conclusions from measurements
Want to dive deeper?
In our latest technical note, we take a closer look at real-world porometry curves, including:
Examples of less ideal curve shapes
Possible causes behind these deviations
The impact of different curve fitting methods on final results
Practical guidance on improving data interpretation
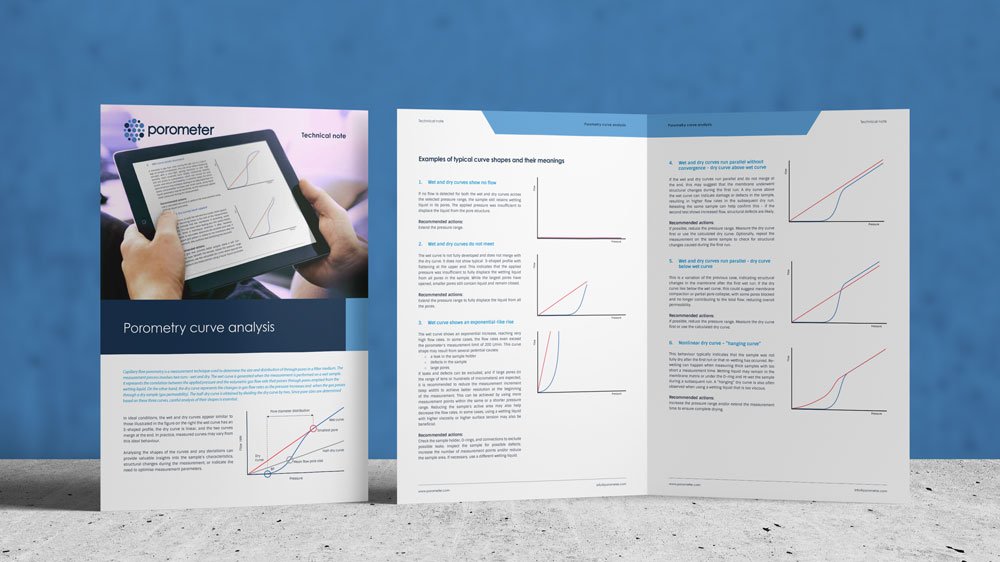
Read our technical note “Porometry curve analysis
“
Request the full technical note and learn how to make the most out of your porometry data.